
Deploy llm-d for Distributed LLM Inference on DigitalOcean Kubernetes
This tutorial will guide you through deploying llm-d on DigitalOcean Kubernetes using our automated deployment scripts. Whether you're a DevOps engineer, ML engineer, or platform architect, this guide will help you establish a distributed LLM inference service on Kubernetes.
⏱️ Estimated Deployment Time: 15-20 minutes
📋 Tutorial Scope: This tutorial focuses on basic llm-d deployment on DigitalOcean Kubernetes with automated scripts.
Overview
llm-d is a distributed LLM inference framework designed for Kubernetes environments, featuring disaggregated serving architecture and intelligent resource management. On DigitalOcean Kubernetes, you can deploy llm-d to achieve:
-
Disaggregated LLM Inference
Separate prefill (context processing) and decode (token generation) stages across different GPU nodes. -
GPU Resource Management
Automatic GPU resource allocation with support for NVIDIA RTX 4000 Ada, RTX 6000 Ada, and L40S cards. -
Kubernetes-Native Architecture
Cloud-native design with proper service discovery and resource management.
What is llm-d?
llm-d represents a next-generation distributed LLM inference platform, specifically designed for Kubernetes environments. Unlike traditional single-node solutions, llm-d brings distributed computing capabilities to LLM inference.

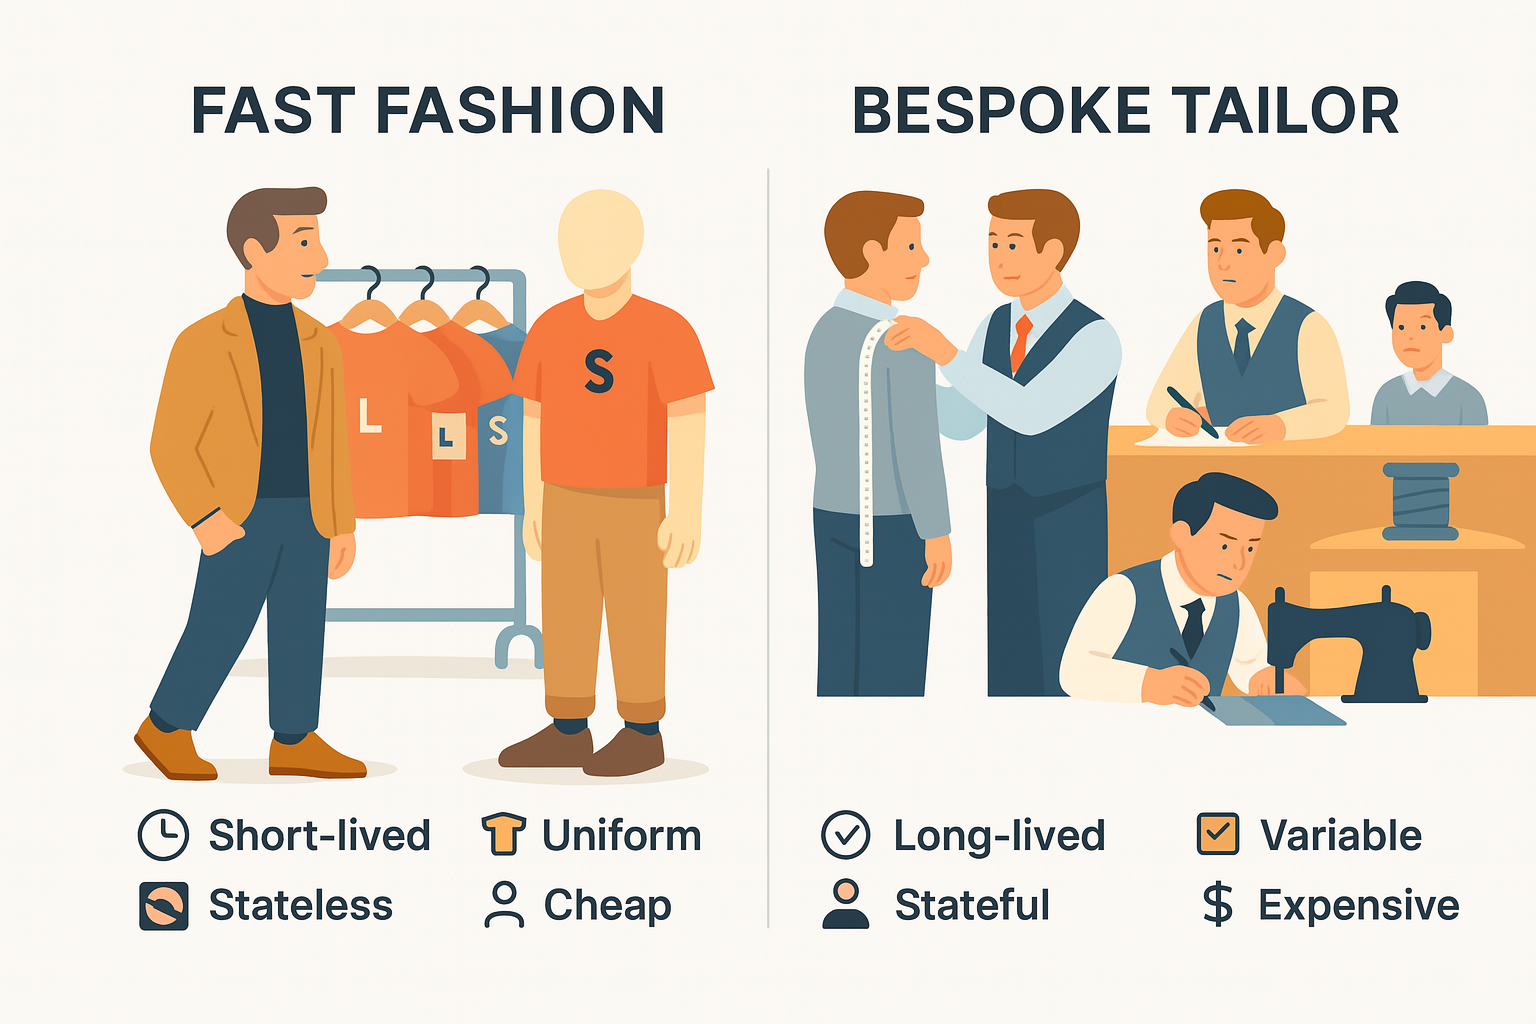
Understanding Disaggregated LLM Inference
Think of the difference between fast fashion retail and bespoke tailoring - this perfectly captures the fundamental differences between traditional web applications and LLM inference:
Traditional Web Applications vs. LLM Inference:
| Comparison Aspect | Traditional Web Apps (Fast Fashion) | LLM Inference (Bespoke Tailoring Workshop) |
|---|---|---|
| Service Process | Store displays S·M·L standard sizes, customers grab and checkout | Measurement → Pattern Making → Fitting → Alterations → Delivery |
| Request Lifespan | Milliseconds to seconds (instant checkout) | Seconds to minutes (stitch by stitch execution) |
| Resource Requirements | Similar fabric and manufacturing time per item | Vastly different fabric usage and handcraft time per suit |
| Statefulness | Staff don't remember your previous purchases | Tailor remembers your measurements and preferences |
| Cost | Low unit price, mass production | High unit price, precision handcraft |
 Traditional LLM Serving = "One-Person-Does-Everything Tailor"
Problems with this approach:
- Resource Imbalance: Some customers need simple hem adjustments, others want full custom suits - workload varies dramatically
- Fabric Waste: Each customer monopolizes a pile of fabric, no sharing of leftover pieces
- Queue Blocking: Complex orders in front block quick alterations behind
llm-d's Disaggregated Approach = "Modern Bespoke Tailoring Production Line"
| Station | Process Analogy | Specialized Optimization |
|---|---|---|
| Prefill Station | Measurement + Pattern Making Room | High parallel computation, CPU/GPU collaboration |
| Decode Station | Sewing Room | Sequential output focus, maximum memory bandwidth |
| Smart Gateway | Master Tailor Manager | Dynamic order assignment based on KV Cache and load |
Benefits Achieved:
- Fabric (KV Cache) Sharing: Similar pattern orders concentrated for high hit rates
- Request Shape Optimization: Hem alterations express lane, formal wear slow lane - each takes its own path
- Independent Scaling: Add more pattern makers during measurement season, more sewers during delivery season
- GPU Memory Efficiency: Measurement phase needs compute-heavy/memory-light; sewing phase needs the opposite - separation allows each to take what it needs
One-Line Summary: Fast fashion emphasizes "grab and go"; bespoke tailoring pursues "measured perfection." llm-d separates measurement from sewing, with intelligent master tailor coordination, making AI inference both personalized and efficient.
Tutorial Steps
Step 1: Clone the Repository and Setup Environment
First, let's get the llm-d deployer repository and set up our environment:
# Clone the llm-d deployer repository
git clone https://github.com/iambigmomma/llm-d-deployer.git
cd llm-d-deployer/quickstart/infra/doks-digitalocean
bash
Prerequisites
- DigitalOcean account with GPU quota enabled
doctlCLI installed and authenticatedkubectlinstalledhelminstalled
Set Required Environment Variables
# Set your HuggingFace token (required for model downloads)
export HF_TOKEN=hf_your_token_here

# Verify doctl is authenticated
doctl auth list
bash
🔐 Important: Model Access Requirements
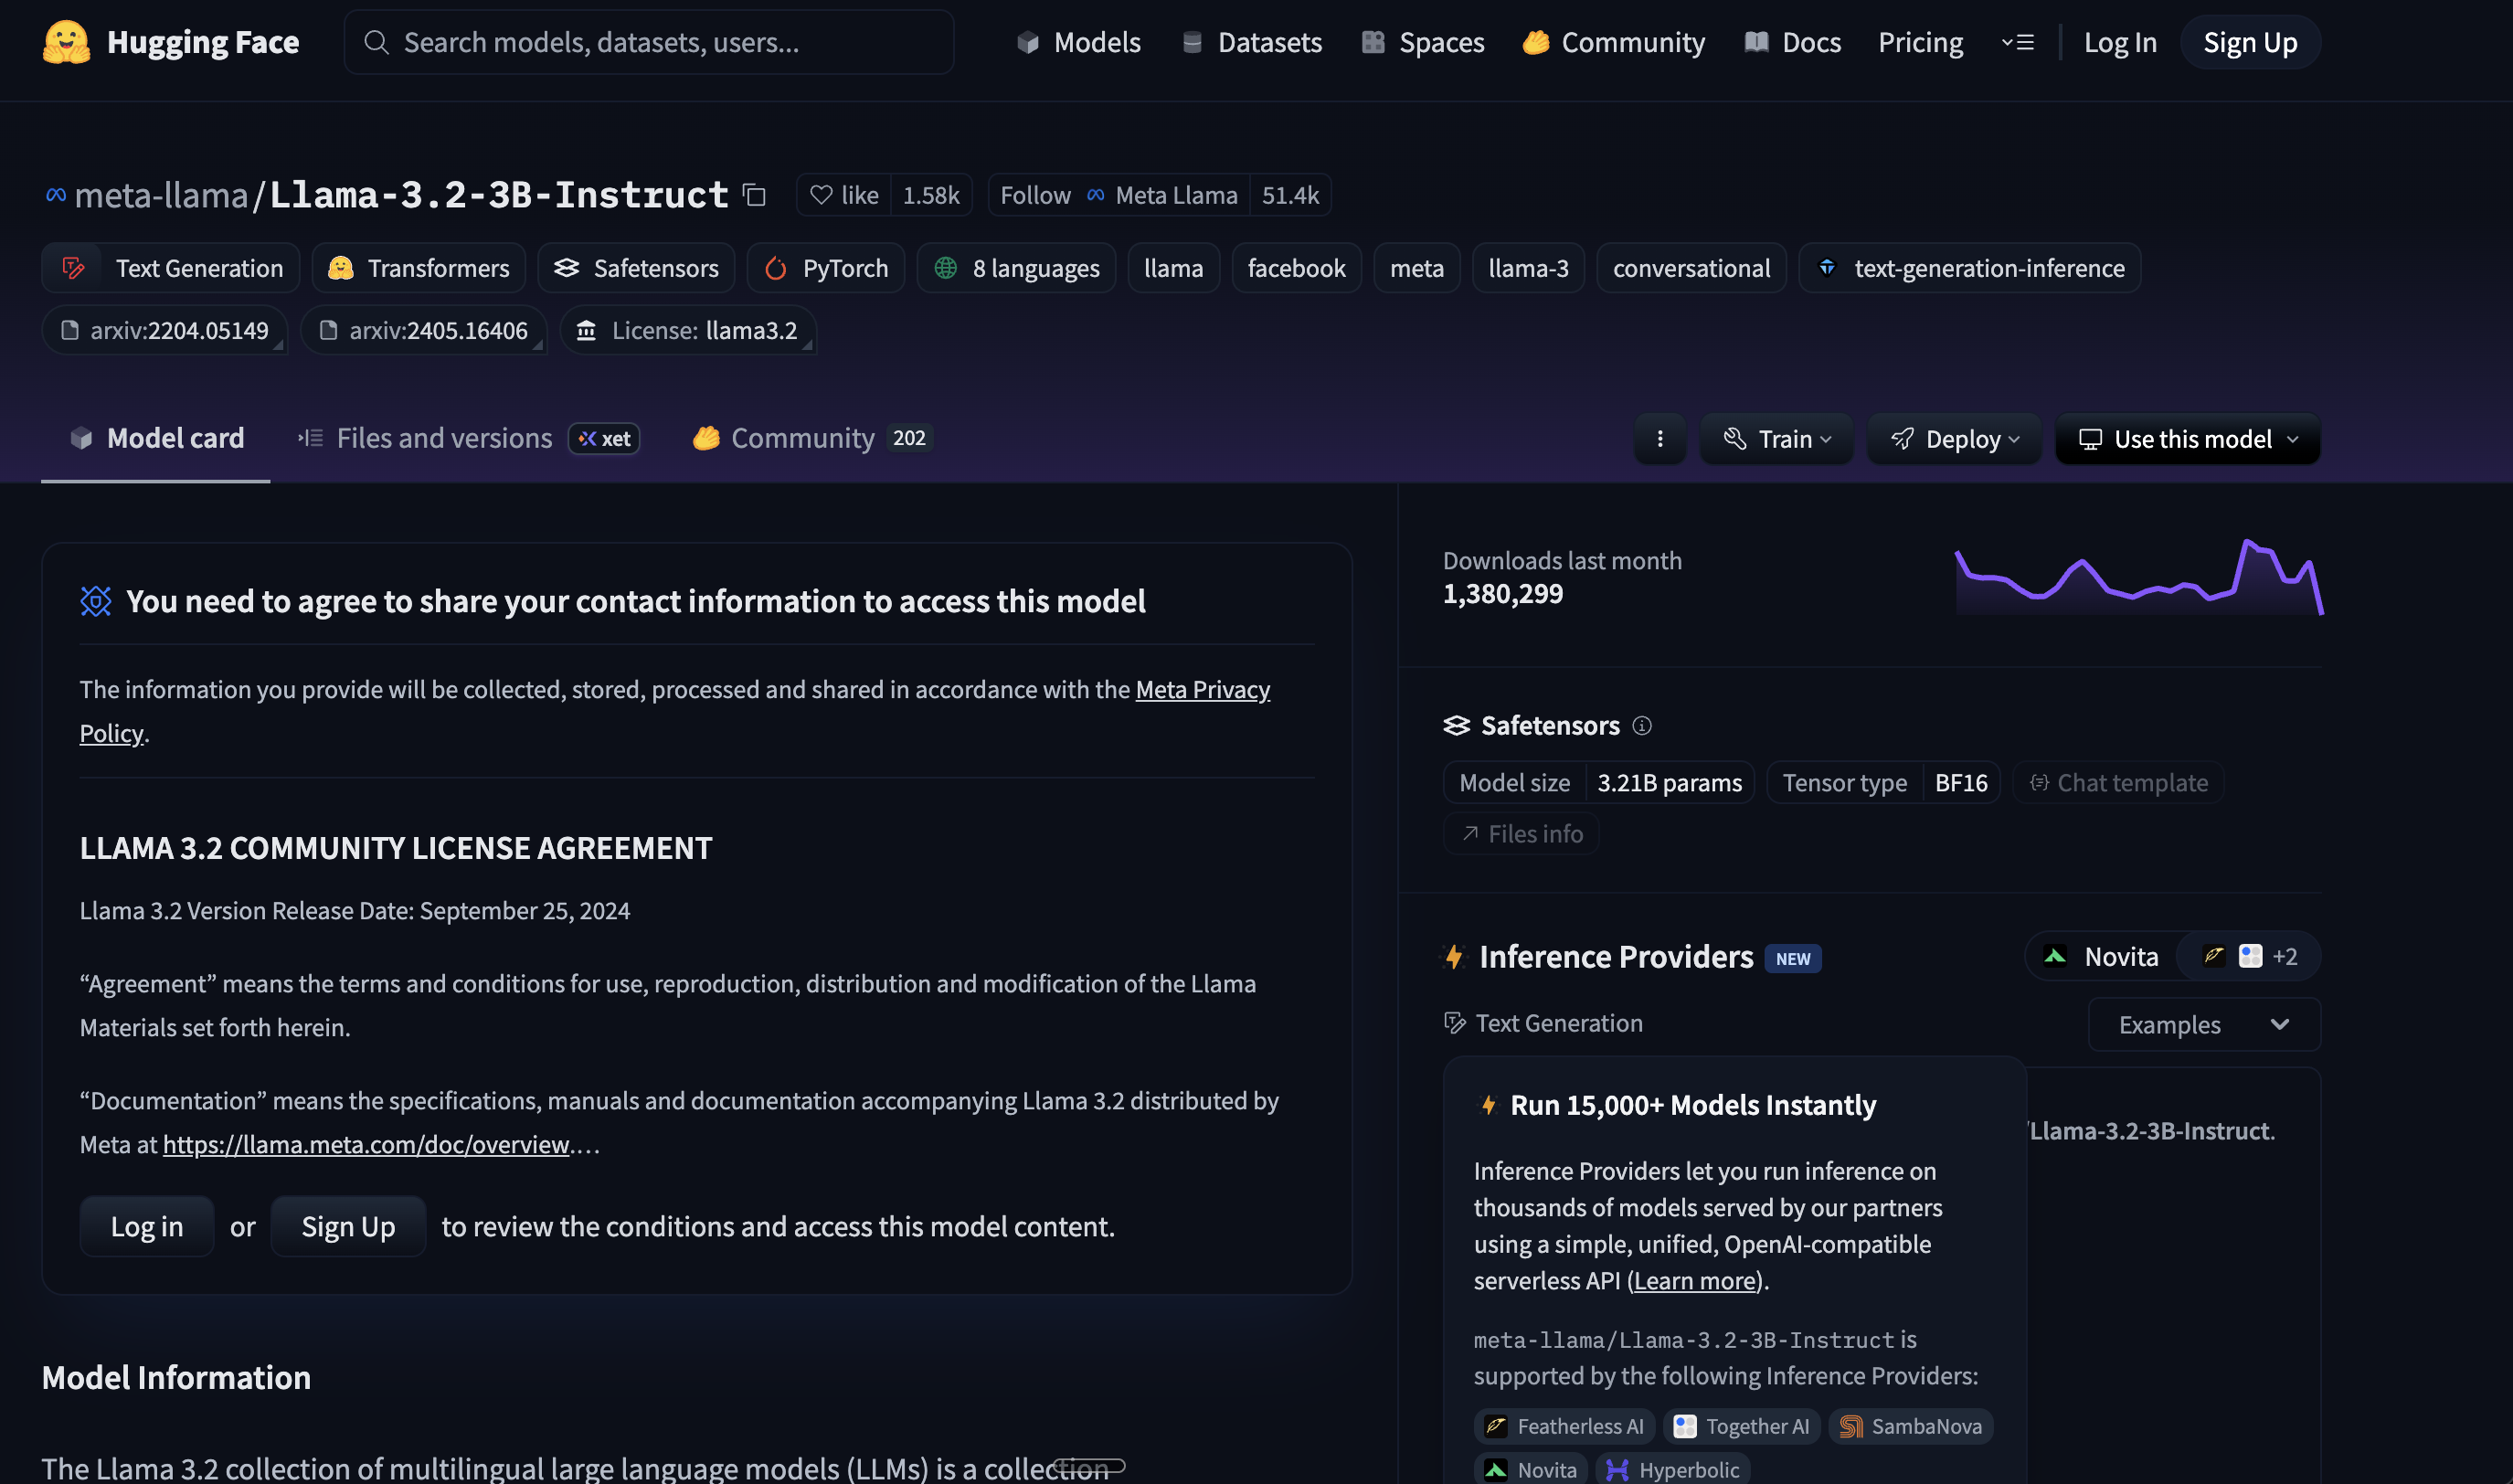
For Meta Llama Models (Llama-3.2-3B-Instruct):
The meta-llama/Llama-3.2-3B-Instruct model used in this tutorial requires special access:
- HuggingFace Account Required: You must have a HuggingFace account
- Model Access Request: Visit Llama-3.2-3B-Instruct on HuggingFace
- Accept License Agreement: Click "Agree and access repository" and complete the license agreement
- Wait for Approval: Access approval is usually granted within a few hours
- Generate Access Token: Create a HuggingFace access token with "Read" permissions from your Settings > Access Tokens
Alternative Open Models (No License Required):
If you prefer to avoid the approval process, consider these open alternatives:
google/gemma-2b-it- Google's open instruction-tuned modelQwen/Qwen2.5-3B-Instruct- Alibaba's multilingual modelmicrosoft/Phi-3-mini-4k-instruct- Microsoft's efficient small model
To use alternative models, you'll need to modify the deployment configuration files accordingly.
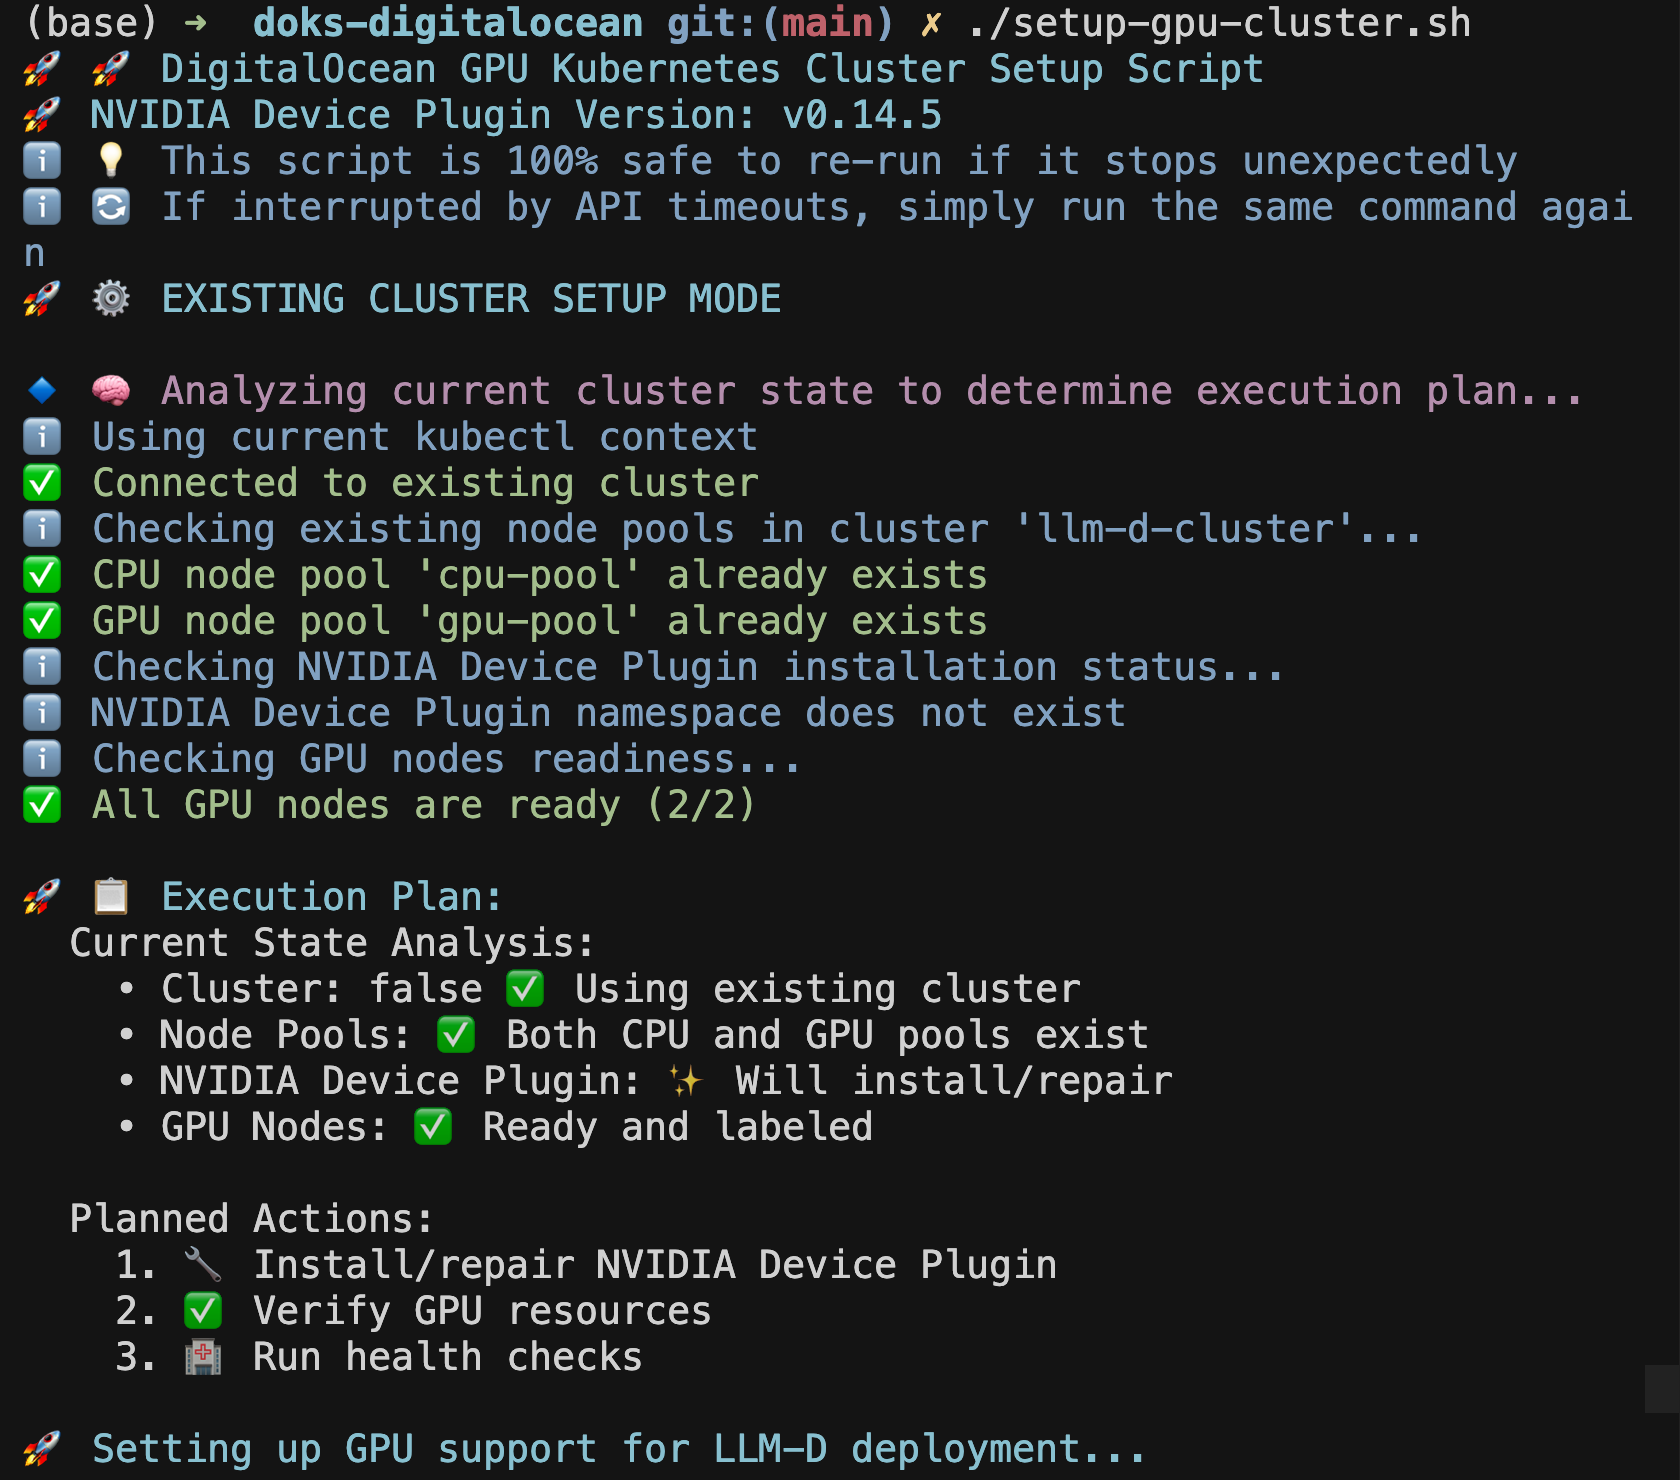
Step 2: Create DOKS Cluster with GPU Nodes
Our automated script will create a complete DOKS cluster with both CPU and GPU nodes:
# Run the automated cluster setup script
./setup-gpu-cluster.sh -c
bash
The script will:
- Create a new DOKS cluster with CPU nodes
- Add a GPU node pool with your chosen GPU type
- Install NVIDIA Device Plugin for GPU support
- Configure proper node labeling and GPU resource management
Choose Your GPU Type
When prompted, select your preferred GPU type:
- RTX 4000 Ada: Cost-effective for smaller models (7B-13B parameters)
- RTX 6000 Ada: Balanced performance for medium models (13B-34B parameters)
- L40S: Maximum performance for large models (70B+ parameters)
Verify Cluster Setup
# Check cluster status
kubectl get nodes

# Verify GPU nodes are ready
kubectl get nodes -l doks.digitalocean.com/gpu-brand=nvidia

# Check GPU resources are available
kubectl describe nodes -l doks.digitalocean.com/gpu-brand=nvidia | grep nvidia.com/gpu
bash
You should see output similar to:
NAME                   STATUS   ROLES    AGE   VERSION
pool-gpu-xxxxx         Ready    <none>   3m    v1.31.1
pool-gpu-yyyyy         Ready    <none>   3m    v1.31.1
bash
🔄 If the Setup Script Stops Unexpectedly
This is completely normal! DigitalOcean API calls may occasionally timeout during node provisioning. If you see the script stop after creating the GPU node pool:
- Wait 30 seconds for the API operations to complete
- Re-run the same command:
./setup-gpu-cluster.shbash
- The script will automatically detect existing components and continue from where it left off
- No duplicate resources will be created - the script is designed to be safely re-run
The script has intelligent state detection and will skip already completed steps, making it completely safe to re-run multiple times.
Step 3: Deploy llm-d Infrastructure
Now let's deploy llm-d using our automated deployment scripts. This is a two-step process for better reliability and troubleshooting:
Step 3A: Deploy llm-d Core Components
First, let's deploy the core llm-d inference services:
# Deploy llm-d with your chosen GPU configuration
./deploy-llm-d.sh -g rtx-6000-ada -t your_hf_token
bash
What Gets Deployed:
- Prefill Service: Handles context processing on GPU pods
- Decode Service: Manages token generation with GPU optimization
- Gateway Service: Routes requests and manages load balancing
- Redis Service: Provides KV cache storage
Step 3B: Setup Monitoring (Optional)
After llm-d is running, optionally setup comprehensive monitoring:
# Navigate to monitoring directory
cd monitoring

# Setup Prometheus, Grafana, and llm-d dashboards
./setup-monitoring.sh
bash
Monitoring Components:
- Prometheus: Metrics collection and storage
- Grafana: Visualization dashboards and alerts
- llm-d Dashboard: Custom inference performance dashboard
- ServiceMonitor: Automatic llm-d metrics discovery
Monitor Deployment Progress
# Watch llm-d deployment progress
kubectl get pods -n llm-d -w

# Check all components are running
kubectl get all -n llm-d
bash
Wait until all pods show Running status:
NAME                                           READY   STATUS    RESTARTS   AGE
meta-llama-llama-3-2-3b-instruct-decode-xxx    1/1     Running   0          3m
meta-llama-llama-3-2-3b-instruct-prefill-xxx   1/1     Running   0          3m
llm-d-inference-gateway-xxx                    1/1     Running   0          3m
redis-xxx                                      1/1     Running   0          3m
bash
Monitor Setup Progress (If Step 3B was completed)
# Check monitoring stack status
kubectl get pods -n llm-d-monitoring

# Access Grafana dashboard
kubectl port-forward -n llm-d-monitoring svc/prometheus-grafana 3000:80
bash
Step 4: Test Your llm-d Deployment
Now let's test that everything is working correctly using our test script:
# Navigate to the test directory
cd /path/to/llm-d-deployer/quickstart

# Run the automated test
./test-request.sh
bash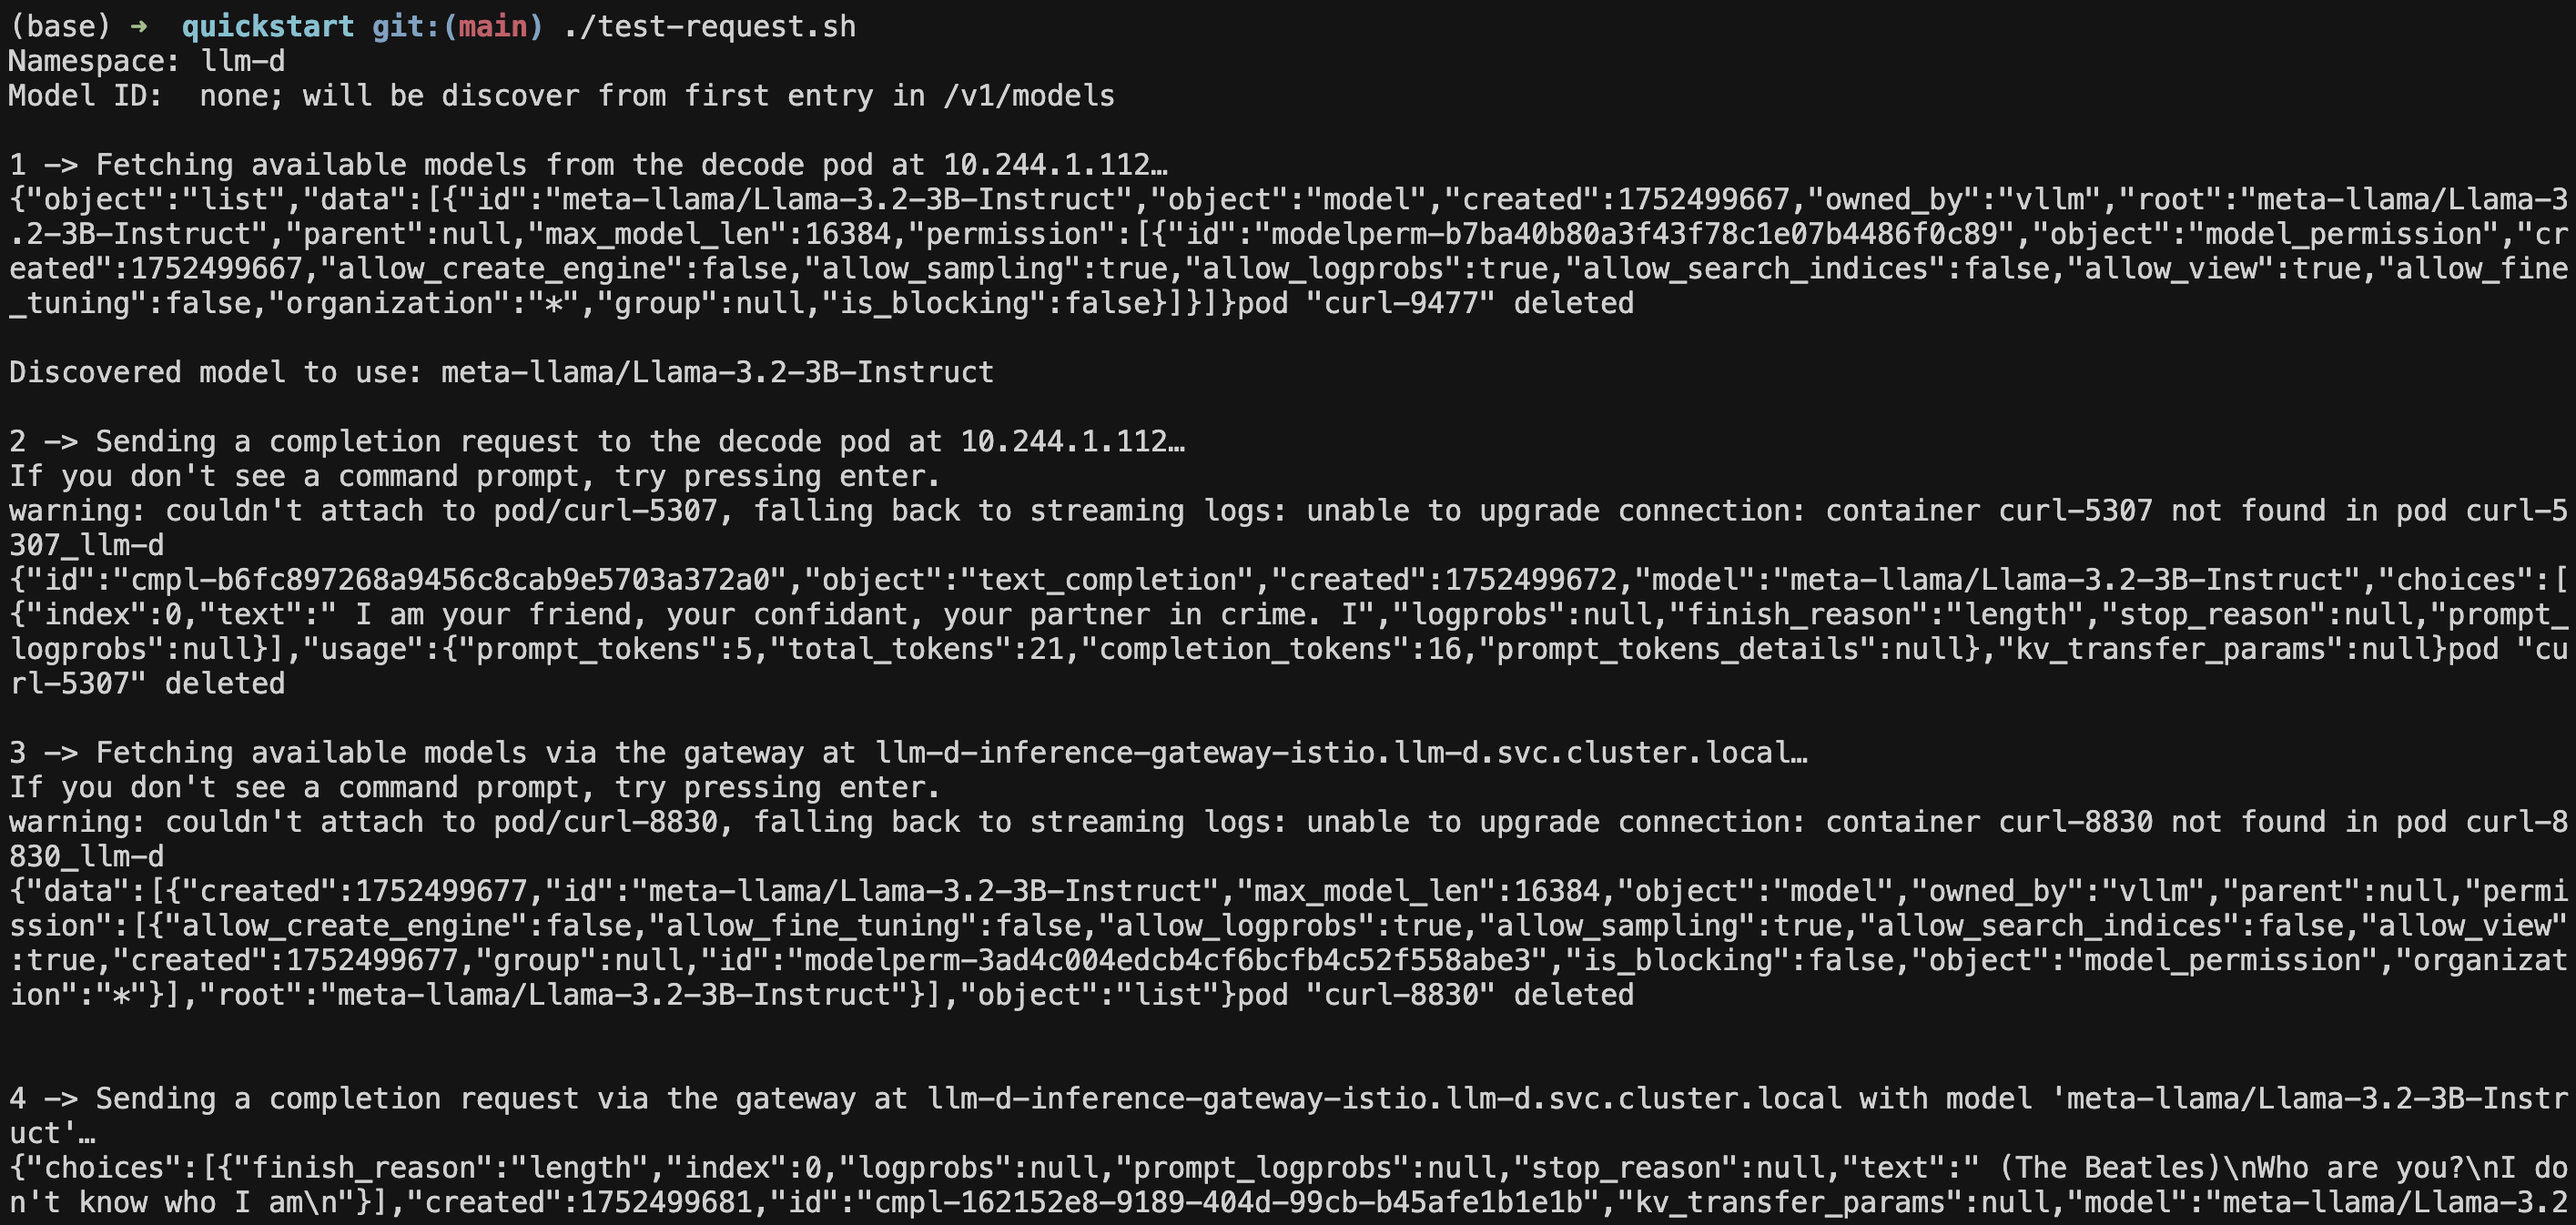
Manual Testing (Alternative)
If you prefer to test manually:
# Port-forward to the gateway service
kubectl port-forward -n llm-d svc/llm-d-inference-gateway-istio 8080:80 &

# Test the API with a simple request
curl localhost:8080/v1/chat/completions \
  -H "Content-Type: application/json" \
  -d '{
    "model": "meta-llama/Llama-3.2-3B-Instruct",
    "messages": [
      {"role": "user", "content": "Explain Kubernetes in simple terms"}
    ],
    "max_tokens": 150,
    "stream": false
  }' | jq
bash
Expected Response
You should see a successful JSON response like:
{
  "choices": [
    {
      "finish_reason": "length",
      "index": 0,
      "logprobs": null,
      "message": {
        "content": "Kubernetes (also known as K8s) is an open-source container orchestration system for automating the deployment, scaling, and management of containerized applications...",
        "reasoning_content": null,
        "role": "assistant",
        "tool_calls": []
      },
      "stop_reason": null
    }
  ],
  "created": 1752523066,
  "id": "chatcmpl-76c2a86b-5460-4752-9f20-03c67ca5b0ba",
  "kv_transfer_params": null,
  "model": "meta-llama/Llama-3.2-3B-Instruct",
  "object": "chat.completion",
  "prompt_logprobs": null,
  "usage": {
    "completion_tokens": 150,
    "prompt_tokens": 41,
    "prompt_tokens_details": null,
    "total_tokens": 191
  }
}
json
Step 5: Access Monitoring and Dashboard
If you completed Step 3B (monitoring setup), you can access the comprehensive monitoring dashboard:
# Port-forward to Grafana
kubectl port-forward -n llm-d-monitoring svc/prometheus-grafana 3000:80

# Get admin password
kubectl get secret prometheus-grafana -n llm-d-monitoring -o jsonpath="{.data.admin-password}" | base64 -d
bash
Grafana Access: http://localhost:3000
Username: admin
Password: (from command above)
llm-d Dashboard and Key Metrics
After monitoring setup, you'll find:
- Dashboard Location: Look for "llm-d" folder in Grafana
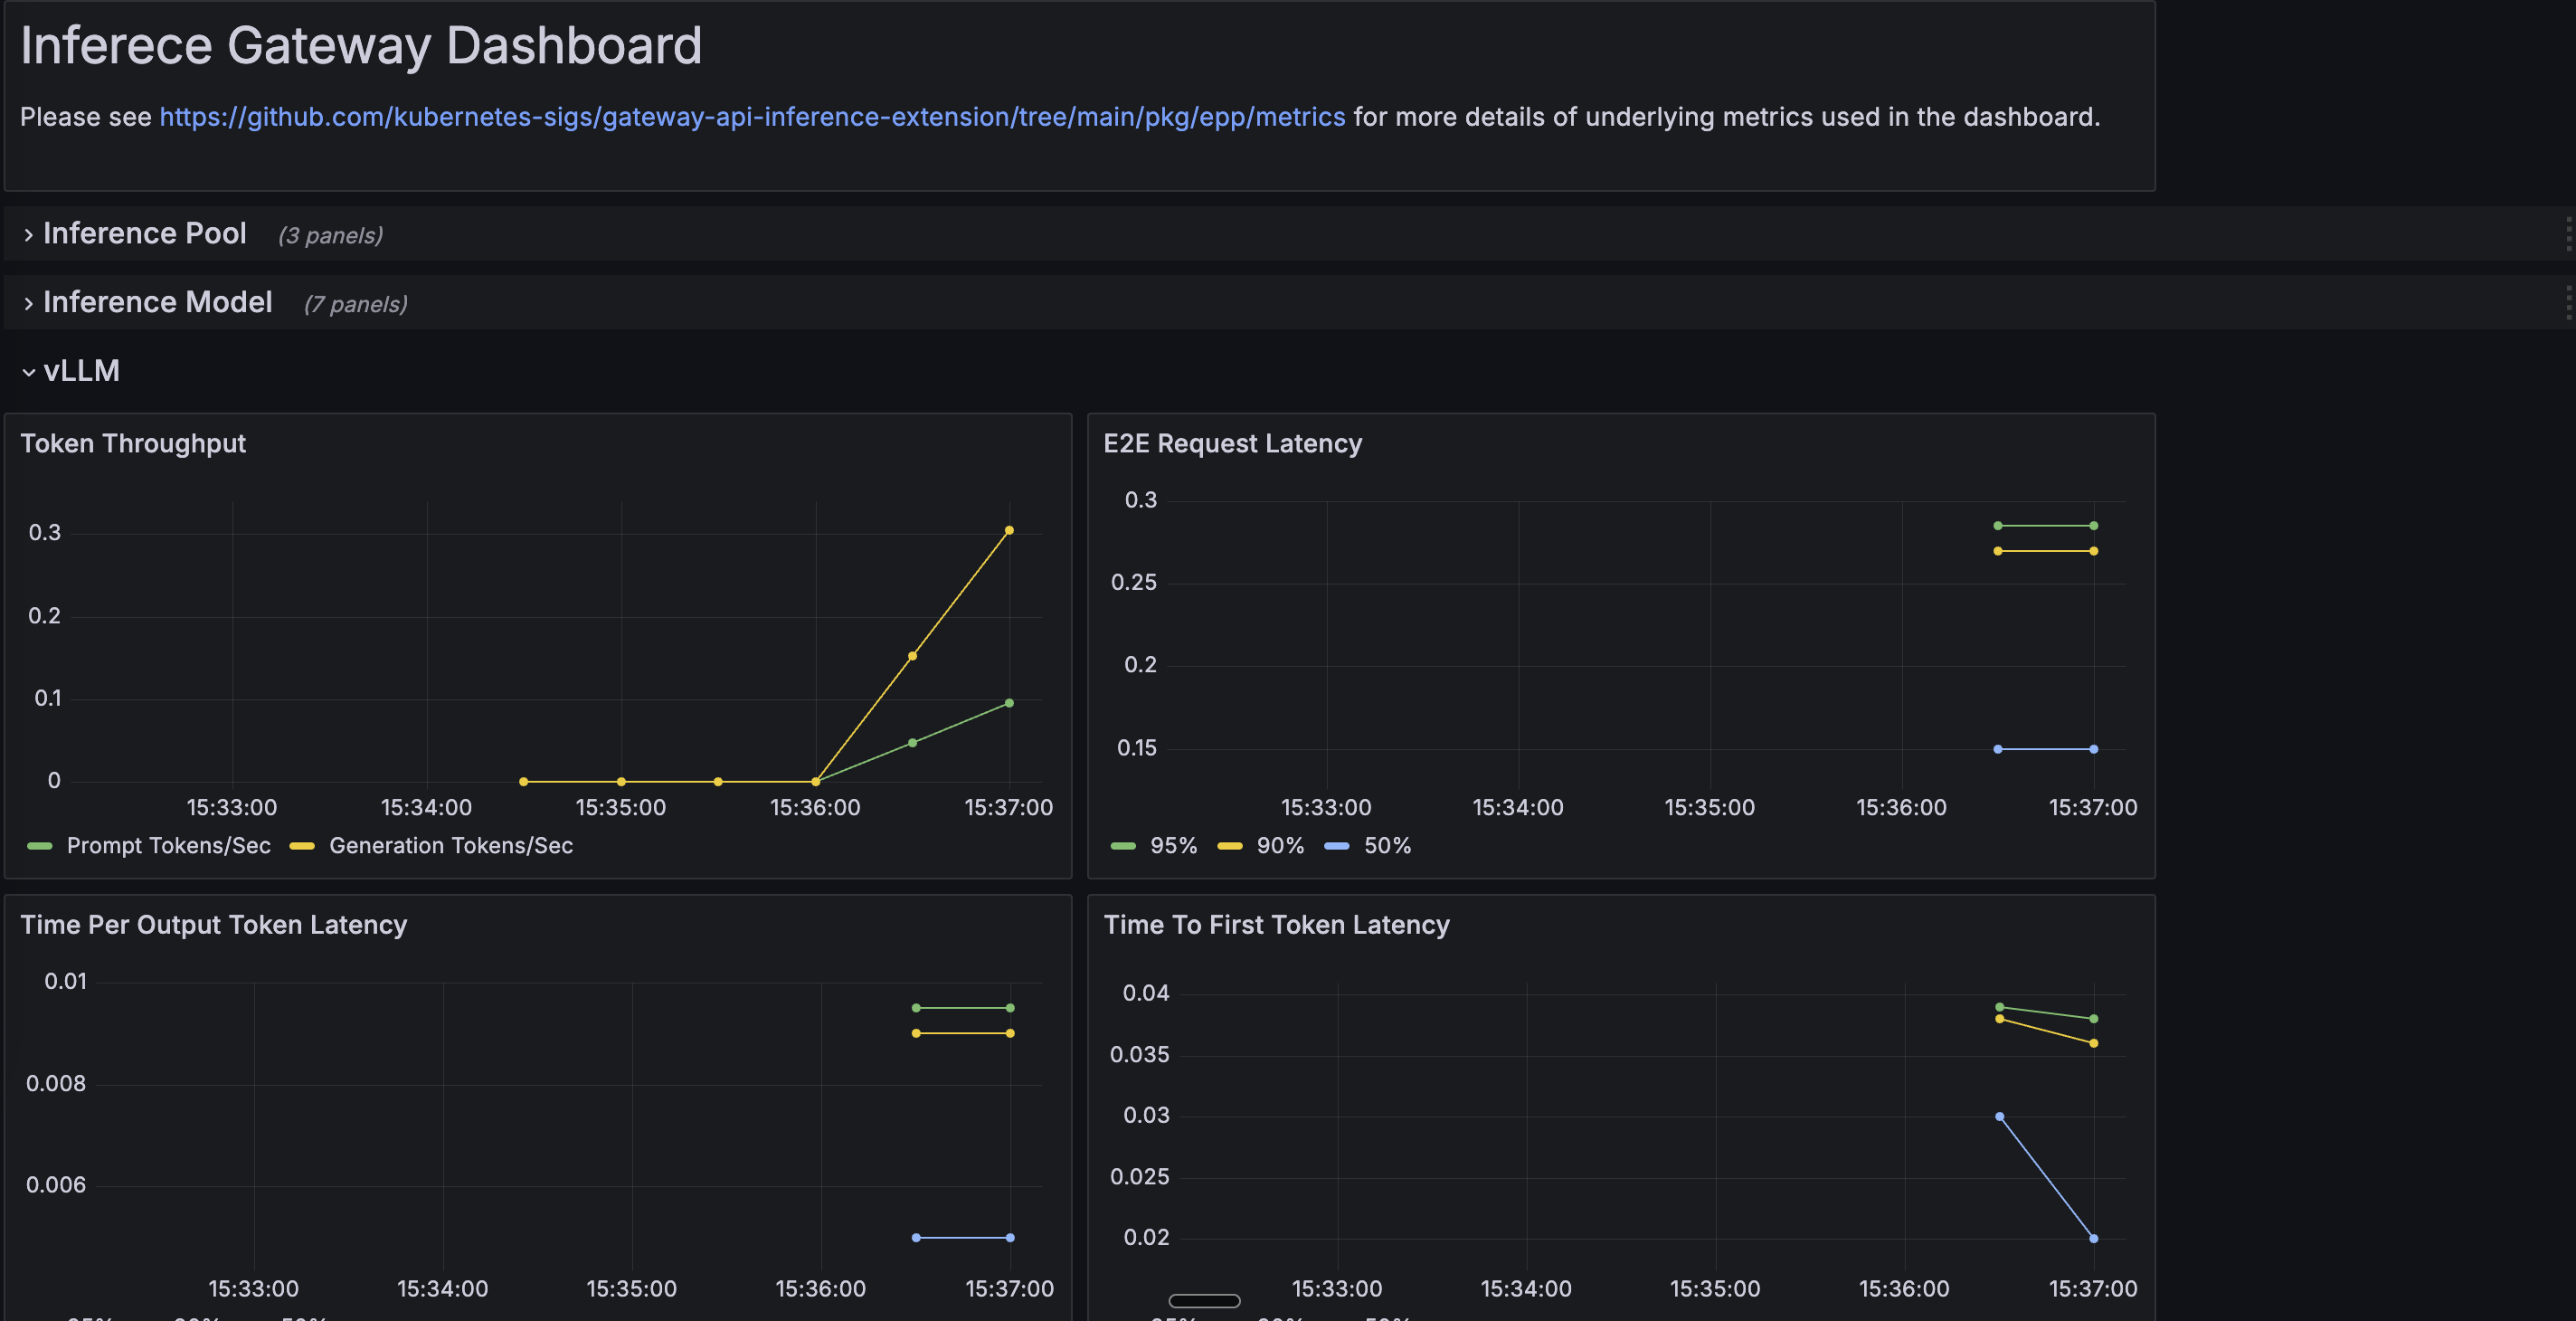
- Dashboard Name: "llm-d Inference Gateway"
The dashboard may take 1-2 minutes to appear as it's loaded by Grafana's sidecar.
📊 Important Metrics to Monitor
Request Performance Metrics:
- Time to First Token (TTFT): Critical for user experience - measures how quickly the first response token is generated
- Inter-Token Latency (ITL): Speed of subsequent token generation - affects perceived responsiveness
- Requests per Second (RPS): Overall system throughput
- Request Duration: End-to-end request completion time
Resource Utilization Metrics:
- GPU Memory Usage: Monitor GPU memory consumption across prefill and decode pods
- GPU Utilization: Actual compute usage percentage of GPUs
- KV Cache Hit Rate: Percentage of requests benefiting from cached computations
- Queue Depth: Number of pending requests waiting for processing
llm-d Specific Metrics:
- Prefill vs Decode Load Distribution: Balance between processing phases
- Cache-Aware Routing Effectiveness: Success rate of intelligent request routing
- Model Loading Time: Time to load models into GPU memory
- Token Generation Rate: Tokens produced per second per GPU
Kubernetes Metrics:
- Pod Autoscaling Events: HPA scaling decisions and timing
- Node Resource Pressure: CPU, memory, and GPU pressure on nodes
- Network Throughput: Inter-pod communication for disaggregated serving
Performance Optimization Indicators:
- Batch Size Utilization: How well requests are batched for efficiency
- Context Length Distribution: Understanding of typical request patterns
- Failed Request Rate: Error rates and their causes
These metrics help you:
- Optimize Performance: Identify bottlenecks in prefill vs decode stages
- Right-Size Resources: Balance cost and performance based on actual usage
- Troubleshoot Issues: Quickly identify problems with specific components
- Plan Capacity: Predict future resource needs based on traffic patterns
Common Issues and Solutions
Setup Script Stops After GPU Node Pool Creation
Symptoms: Script terminates after "GPU node pool created successfully" Cause: DigitalOcean API response delays during node provisioning (this is normal!) Solution:
# Wait 30 seconds, then re-run the script
./setup-gpu-cluster.sh

# The script will automatically continue from where it left off
# No duplicate resources will be created
bash
GPU Pod Scheduling Issues
Symptoms: Pods stuck in Pending state
Solution: Check GPU node availability and resource requests
kubectl describe pods -n llm-d | grep -A 5 "Events:"
bash
Model Download Failures
Symptoms: Pods showing download errors Solution: Verify HF_TOKEN is set correctly
kubectl logs -n llm-d -l app=decode
bash
Service Connectivity Issues
Symptoms: API requests failing Solution: Check all pods are running and services are available
kubectl get pods -n llm-d
kubectl get svc -n llm-d
bash
Dashboard Not Appearing in Grafana
Symptoms: llm-d dashboard not visible in Grafana after running monitoring setup Solution: Check dashboard ConfigMap and Grafana sidecar
# Check if dashboard ConfigMap exists
kubectl get configmap llm-d-dashboard -n llm-d-monitoring

# Check ConfigMap labels
kubectl get configmap llm-d-dashboard -n llm-d-monitoring -o yaml | grep grafana_dashboard

# If missing, re-run monitoring setup
cd monitoring && ./setup-monitoring.sh
bash
Next Steps
Congratulations! You now have a working llm-d deployment on DigitalOcean Kubernetes. Your deployment includes:
✅ DOKS Cluster: With CPU and GPU nodes properly configured
✅ llm-d Services: Prefill, decode, gateway, and Redis running
✅ GPU Support: NVIDIA Device Plugin configured for GPU scheduling
✅ Working API: Tested and confirmed LLM inference capability
What You Can Do Next
- Scale Your Deployment: Add more GPU nodes or increase pod replicas
- Deploy Different Models: Use different model configurations
- Monitor Performance: Use Grafana dashboards to track metrics
- Integrate with Applications: Use the OpenAI-compatible API in your applications
Cleanup (Optional)
When you're done experimenting, you have two cleanup options:
Option 1: Remove Only llm-d Components (Keep Cluster)
If you want to keep your DOKS cluster but remove llm-d components:
# Navigate back to the deployment directory
cd /path/to/llm-d-deployer/quickstart/infra/doks-digitalocean

# Remove llm-d components using the uninstall flag
./deploy-llm-d.sh -u

# Optionally remove monitoring (if installed)
# kubectl delete namespace llm-d-monitoring
bash
This will:
- Remove all llm-d pods and services
- Delete the llm-d namespace
- Keep monitoring components (if installed separately)
- Keep your DOKS cluster and GPU nodes intact for future use
Option 2: Delete Entire Cluster
If you want to remove everything including the cluster:
# Delete the cluster (this will remove all resources)
doctl kubernetes cluster delete llm-d-cluster
bash
💡 Tip: Use Option 1 if you plan to experiment with different llm-d configurations or other Kubernetes workloads on the same cluster. Use Option 2 for complete cleanup when you're finished with all experiments.
Resources
- llm-d Documentation: Official llm-d Docs
- DigitalOcean Kubernetes: DOKS Documentation
- GPU Droplet Pricing: DigitalOcean GPU Pricing
Happy deploying with llm-d on Kubernetes! 🚀


